CS 352: Machine Perception of Music and Audio - Northwestern University - Prof. Annie Chu
About
For my project, I built a pitch correction (autotune) system in python. Autotune is everywhere in the music I listen to, but it has always been a blackbox to me. The motivation behind this project was that I wanted to understand how autotune works by building it myself, and to investigate questions like what the difference is between a barely-noticeable autotune and a robotic T-Pain-like sound. Additionally, I wanted to end up with an easily-usable system that me or my friends could play around with if we ever wanted to record some vocals as there is a lack of free, straightforward autotune systems online.
A high-level overview of my pipeline is described in the Pipeline Overview section.
Quantitative analysis was used to evaluate my system and is described in depth in the Quantitative Testing section. Qualitative analysis was also conducted by me, with my analysis sprinkled throughout the website. At a high level, the correction settings work mostly as intended: at full strength, the system produces the noticeably robotic sound that people associate with strong autotune, and the results are similar to an external baseline pitch correction system. However, some notable limitations I identified were:
Inherent pitch-tracking error in CREPE led to occasional MIDI note misclassifications on notes that were more heavily detuned.
Pitch tracking is less reliable at the start and end of audio snippets and around note transitions, leading to audible artifacts like jumpy transitions at note boundaries. This is likely due to a lack of context needed for the windowed-filter smoothing and CREPE.
The timbre and vibrato of real instrument or vocal samples can cause audible artifacts on sustained notes.
There are some occasionally noticeable differences in clarity between the input and corrected output audios.
Pipeline Overview
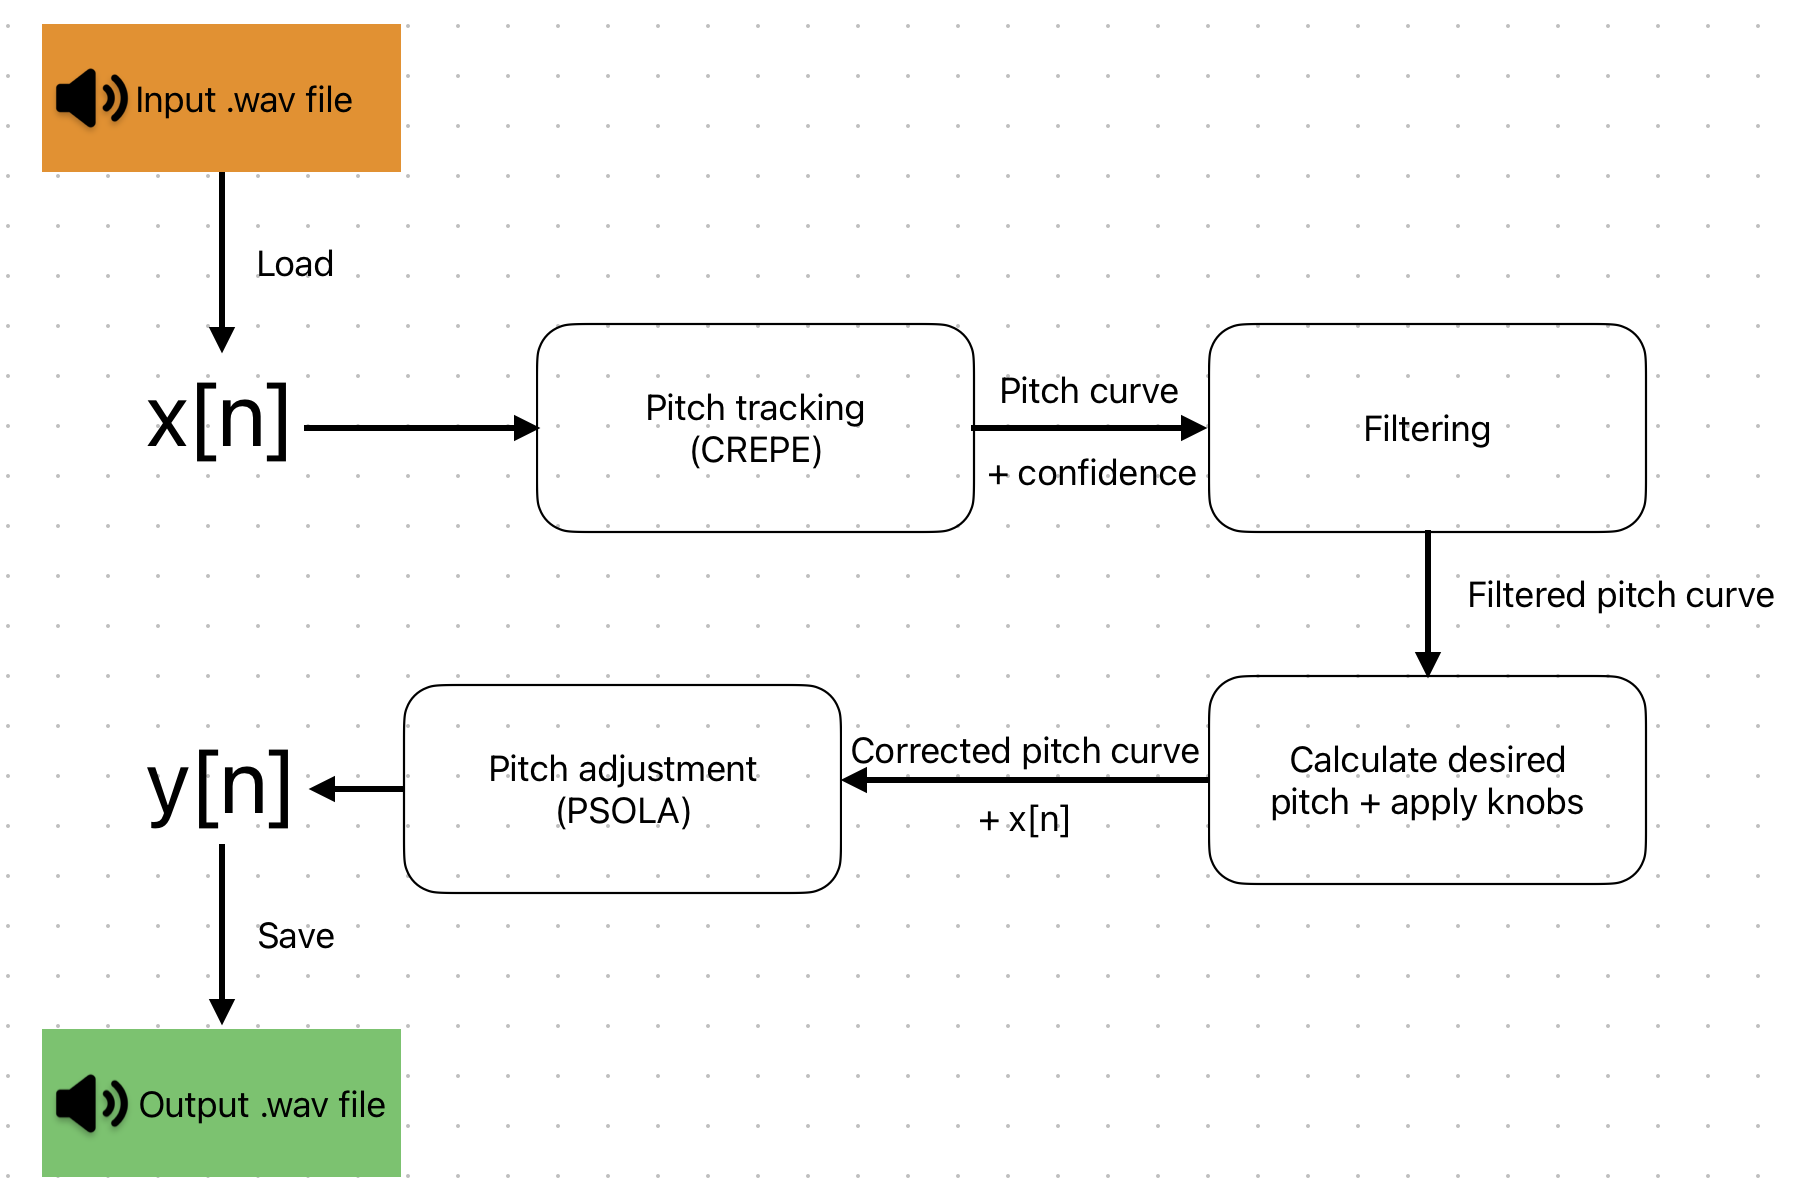
The pipeline consists of four major steps, shown in Fig. 1
[Fig. 1] Pipeline architecture
The following happens in each step:
Pitch tracking: the waveform is passed into torchcrepe [1], which produces a pitch curve of estimated f0 values for each 5ms time frame, along with a confidence array indicating how confident torchcrepe is in each estimate.
Filtering and masking: a median filter smooths noisy values in the confidence array, Then any frame below a confidence and silence threshold is masked out. A mean filter is then run over the pitch curve to remove boundary artifacts.
Pitch adjustment: each frame's frequency is snapped toward the nearest MIDI note. How aggressively this happens is controlled by three adjustable knobs:
Strength (0.0 - 1.0): how far each frame is pulled toward its target note. 0 leaves the pitch untouched; 1 snaps it fully onto the target.
Deadzone (cents): a band around the target inside which no correction is applied, to preserve natural vibrato/expression near the note. 0 disables the deadzone entirely.
Retune speed (0.0 - 1.0): how quickly the corrected curve glides toward each new target frame-to-frame. 1 snaps instantly with no glide.
Pitch shifting: the original waveform and the corrected pitch curve are passed into psola.vocode() [2], an implementation of the PSOLA algorithm, to resynthesize the corrected audio.
Quantitative Testing
Detuned Sine Tones
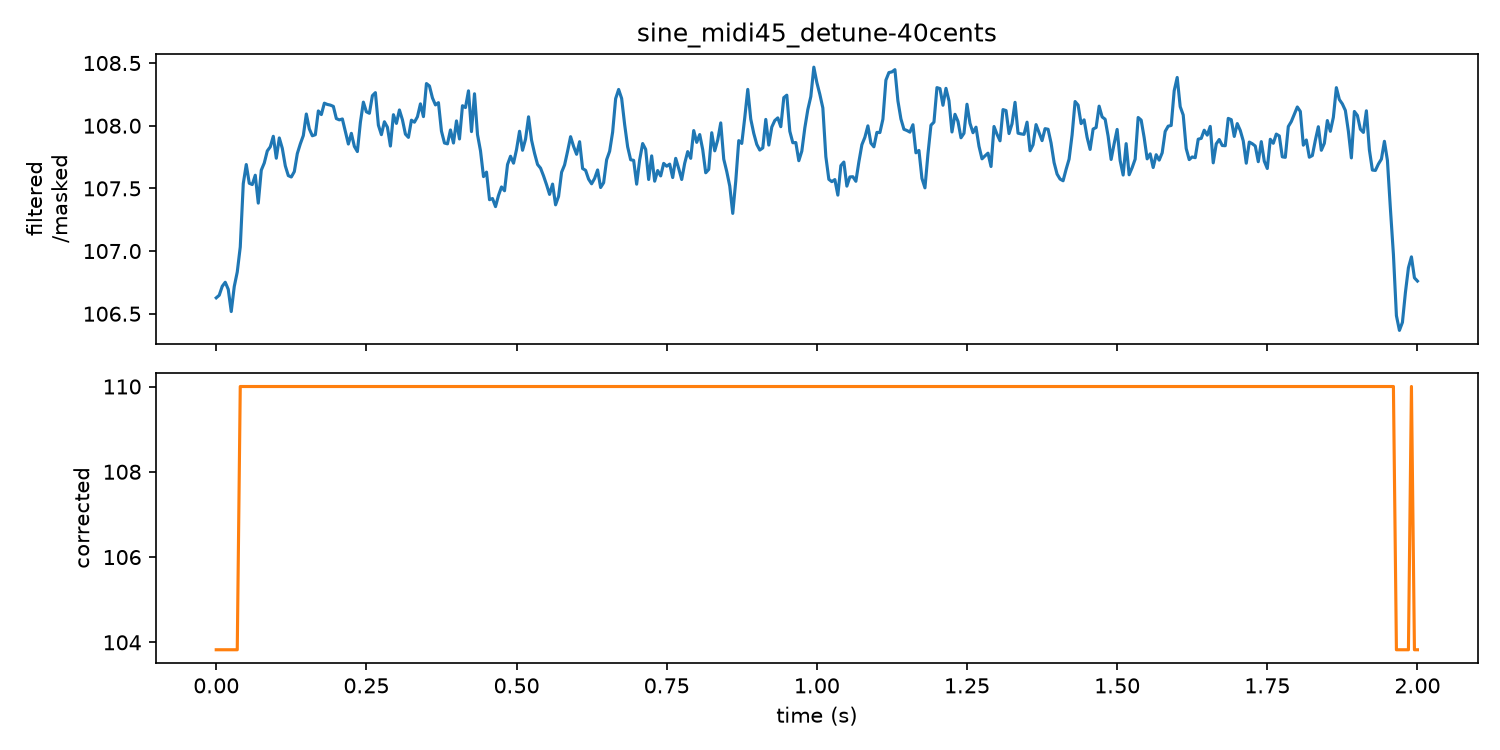
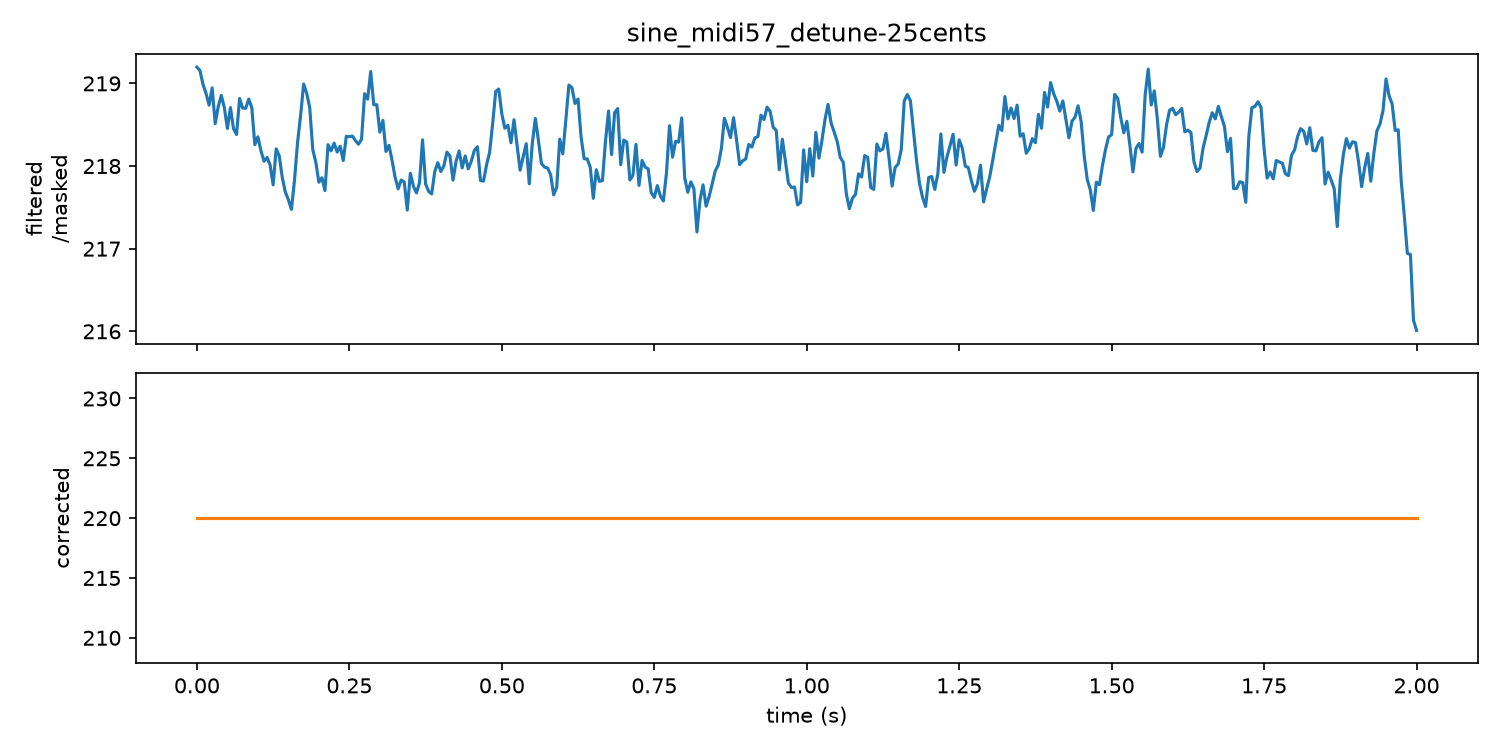
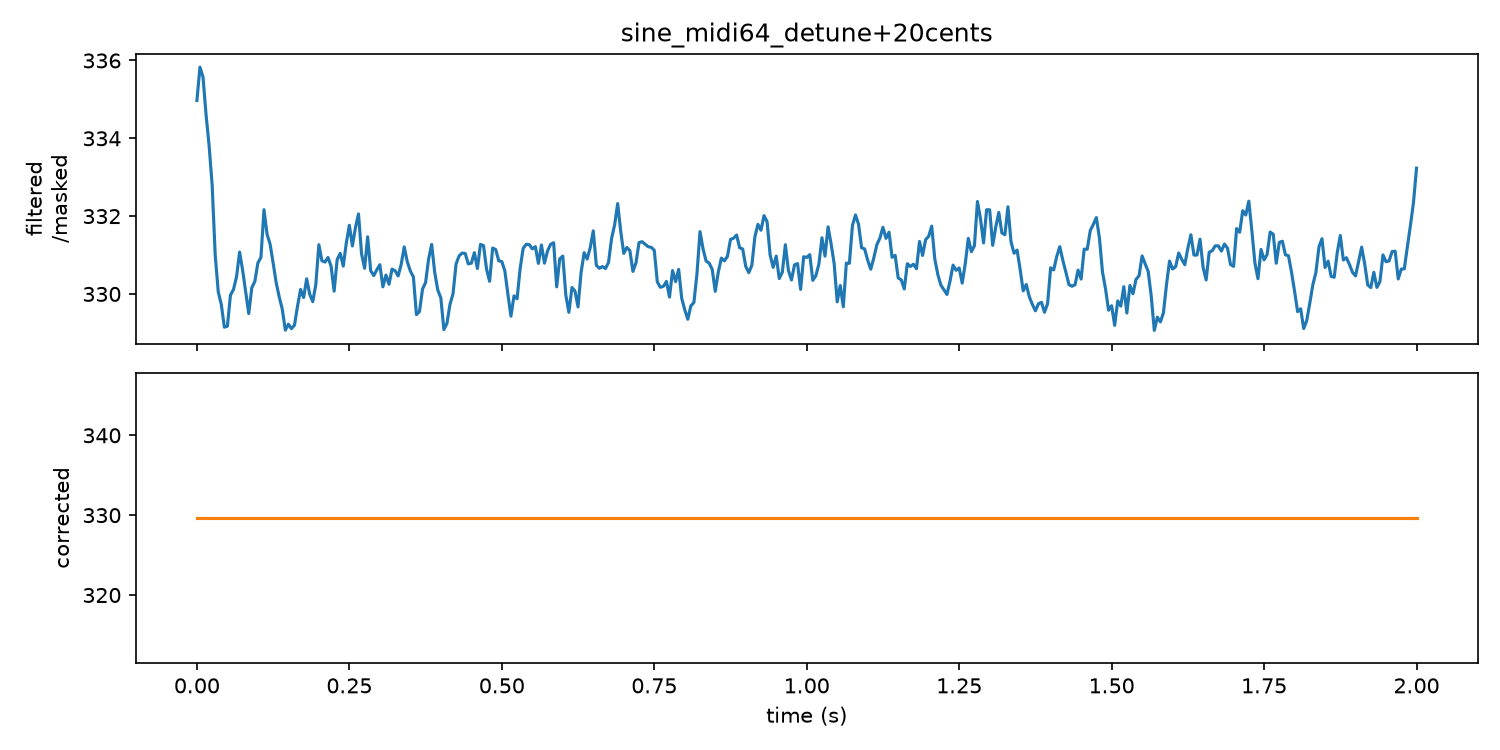
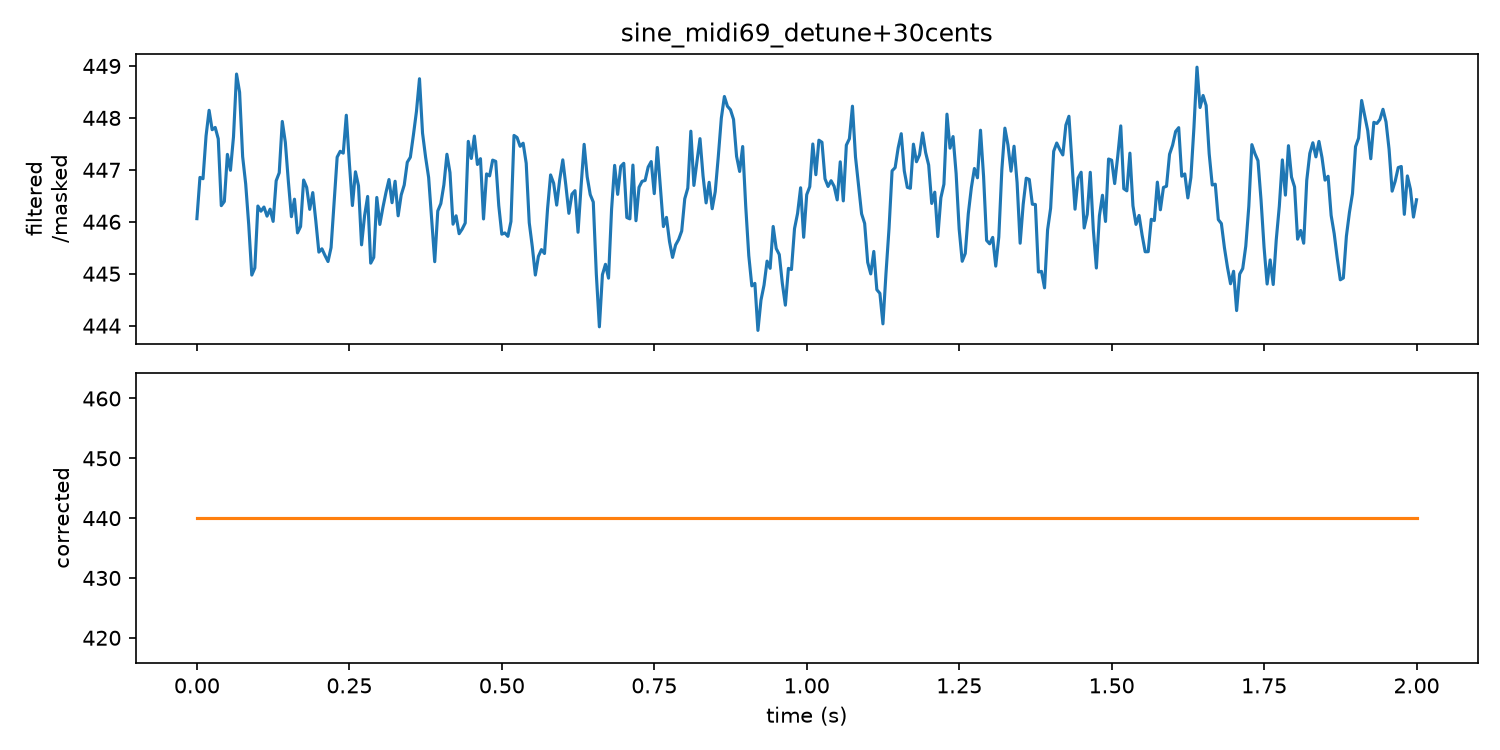
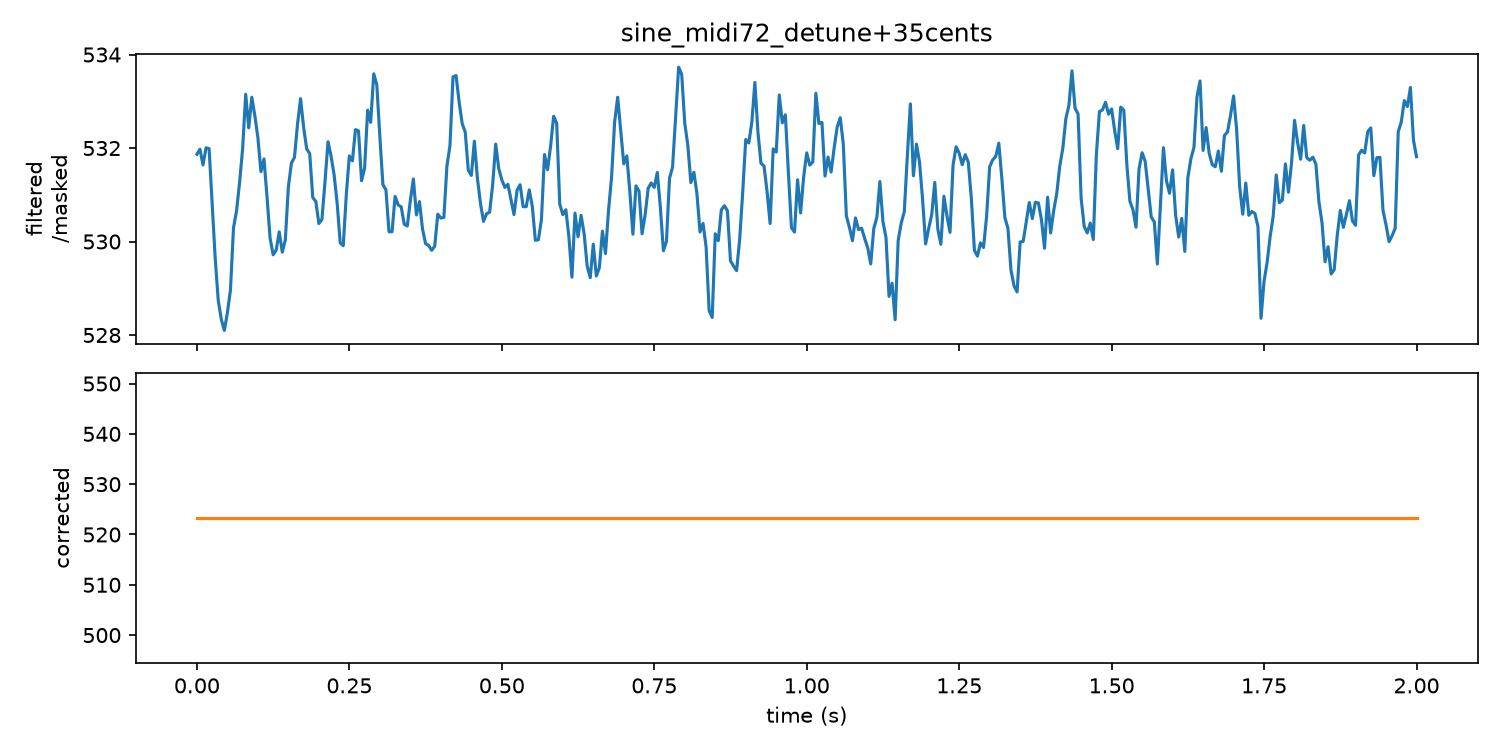
As a sanity check, five pure sine tones were generated at known MIDI pitches, each detuned by a different, known amount (up to 40 cents). Each tone was run through pitch tracking, filtering, and pitch correction at full correction strength, stopping just before the PSOLA pitch-shifting stage, and the resulting corrected pitch curve was compared against the true target frequency.
In each plot below, the top panel shows the pitch curve after tracking and filtering; the bottom panel shows the corrected pitch curve after snapping to the nearest note.
The reported error is the maximum per-frame error across all voiced frames in the corrected pitch curve, converted from Hz to cents relative to the true target frequency: error = max(1200 · log2(corrected_hz / true_hz)). Since correction always rounds each frame to the nearest semitone, a frame's error is essentially binary: it lands on the correct note (0 cents) or the wrong neighboring note (100 cents), so the worst single frame is a more meaningful summary than an average across the clip.
True Note
Detune (cents)
Before
After
Pitch Curve (Filtered → Corrected)
Max Correction Error (cents)
A2 (110.00 Hz)
-40
-100
A3 (220.00 Hz)
-25
0
E4 (329.63 Hz)
+20
0
A4 (440.00 Hz)
+30
0
C5 (523.25 Hz)
+35
0
[Table. 1] Detuned sine tone correction results.
The first thing to notice is that the estimated pitch curve is not perfectly flat. This is due to inherent uncertainty/error in torchcrepe's pitch estimation.
Another thing to notice is that the clarity of the samples change after correction in some cases (and for many examples throughout the website). I was unable to pinpoint if this was caused by an isolated part of the pipeline (ie. PSOLA reconstruction) or a combination of many parts).
Four of the five tones have an error of essentially zero, confirming that the correction logic works as intended in these cases.
The more interesting pattern is a small "tail" visible near the beginning and end of several of the estimated pitch curves. This likely happens as CREPE and the windowed smoothing filters lack surrounding context for the most accurate results. In most cases the tail is small enough that it doesn't change which note the corrected curve snaps to, but for the tone with the largest detune (A2, at -40 cents), it was enough to tip a few boundary frames onto the wrong note. This is a good concrete example of artifacts at the boundaries of notes noted in the About section.
Detuned NSynth Stems
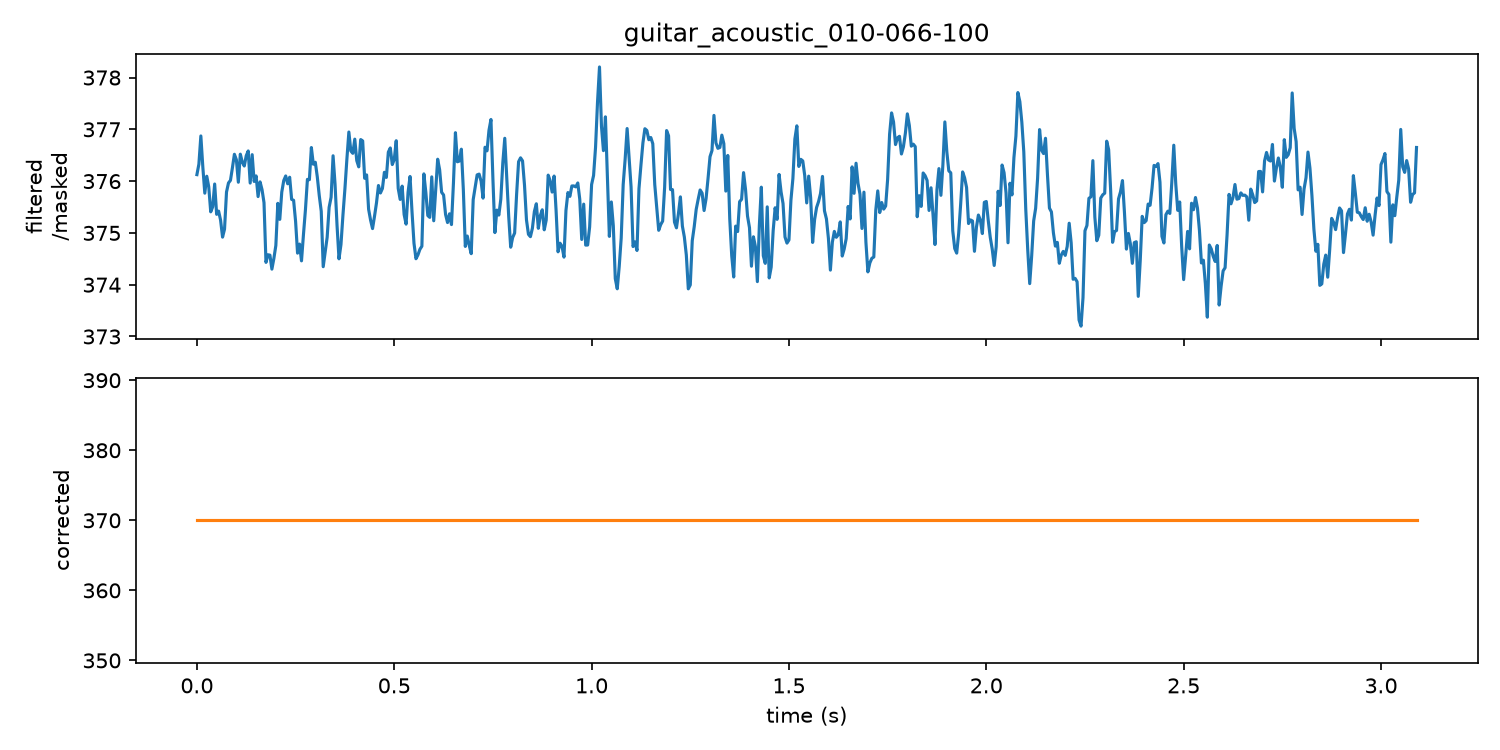
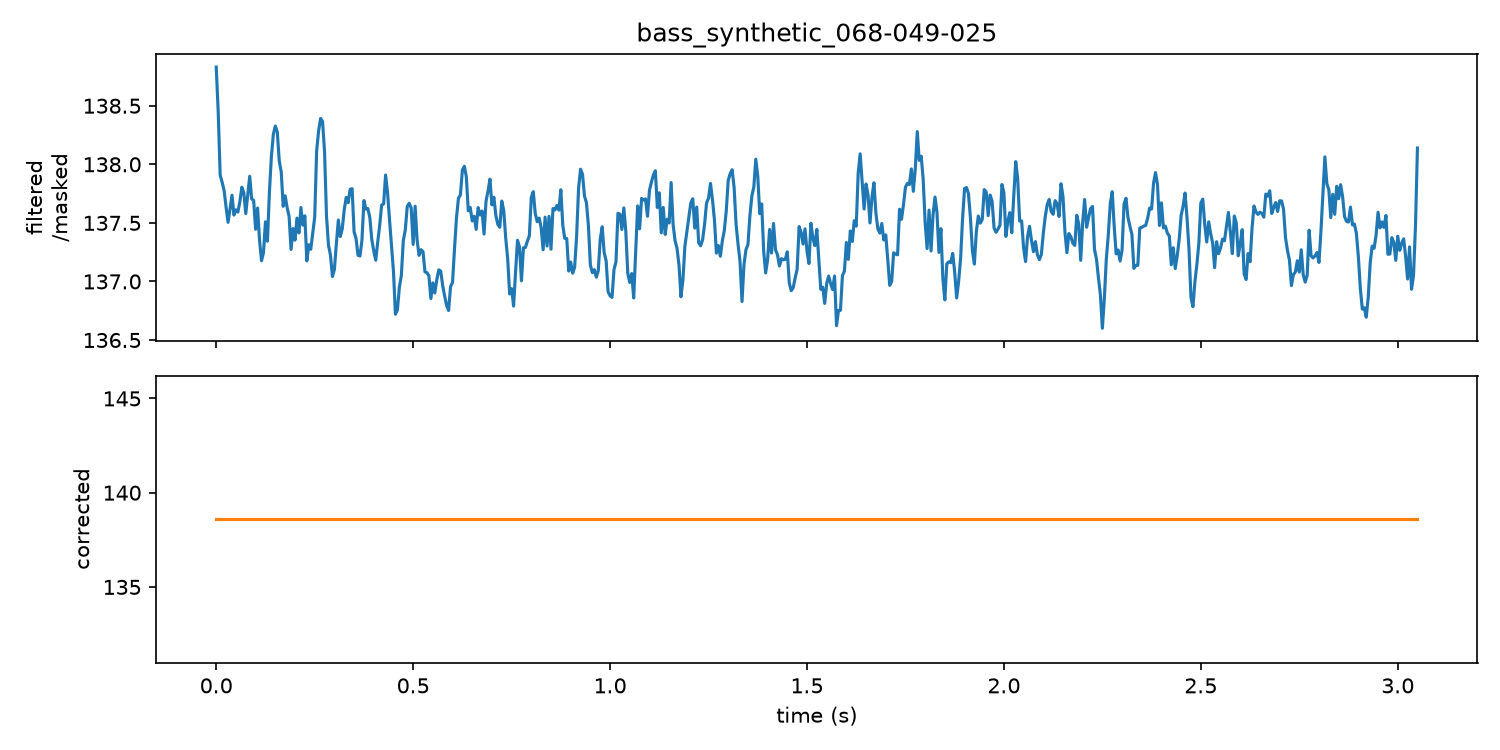
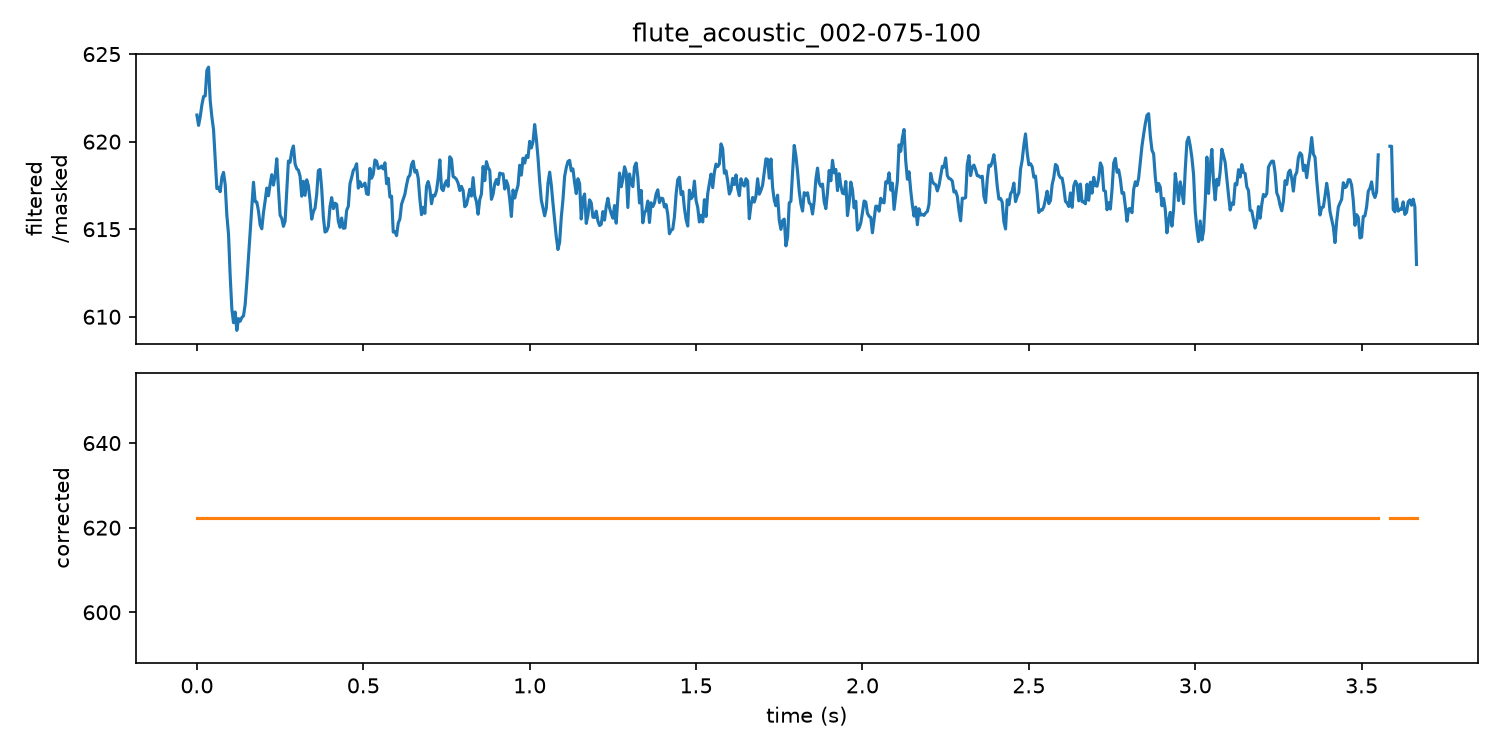
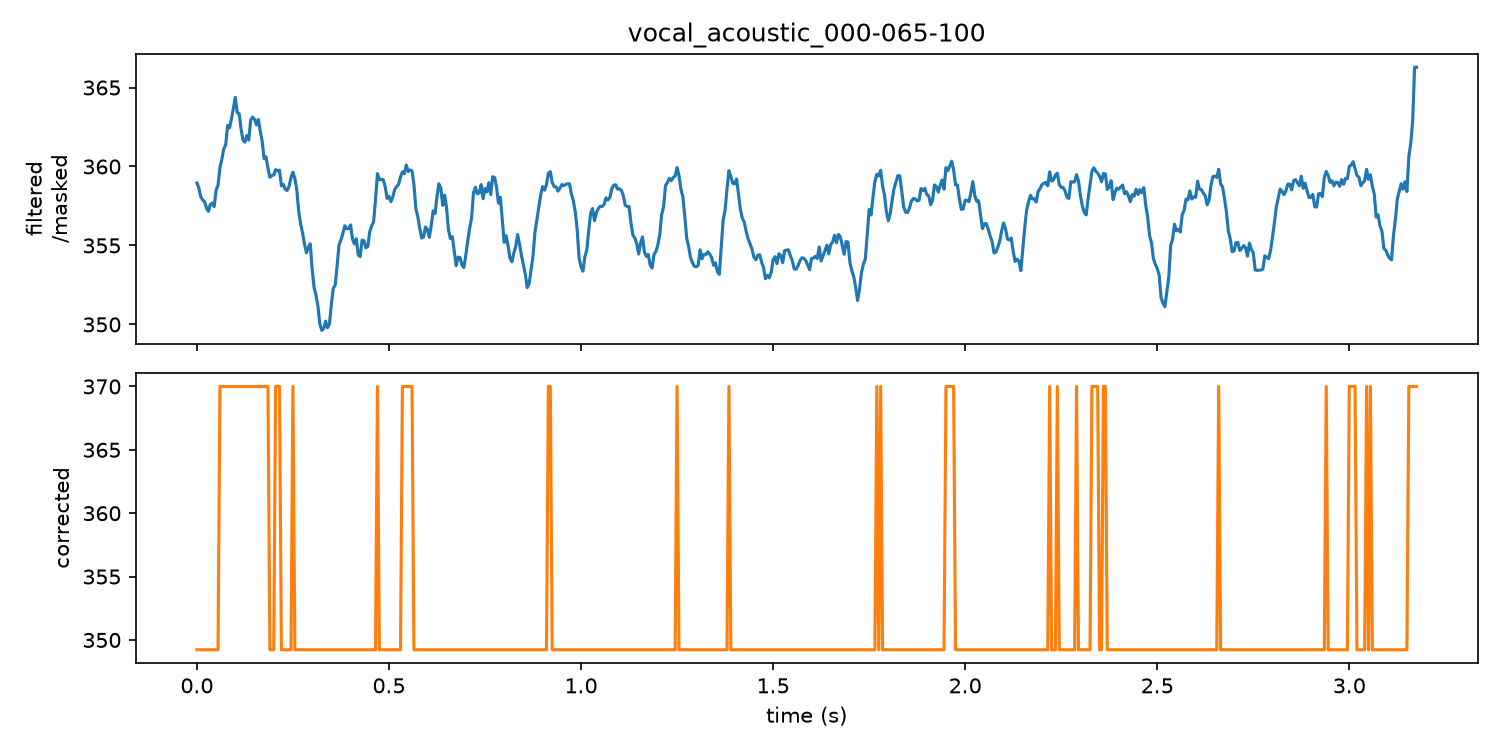
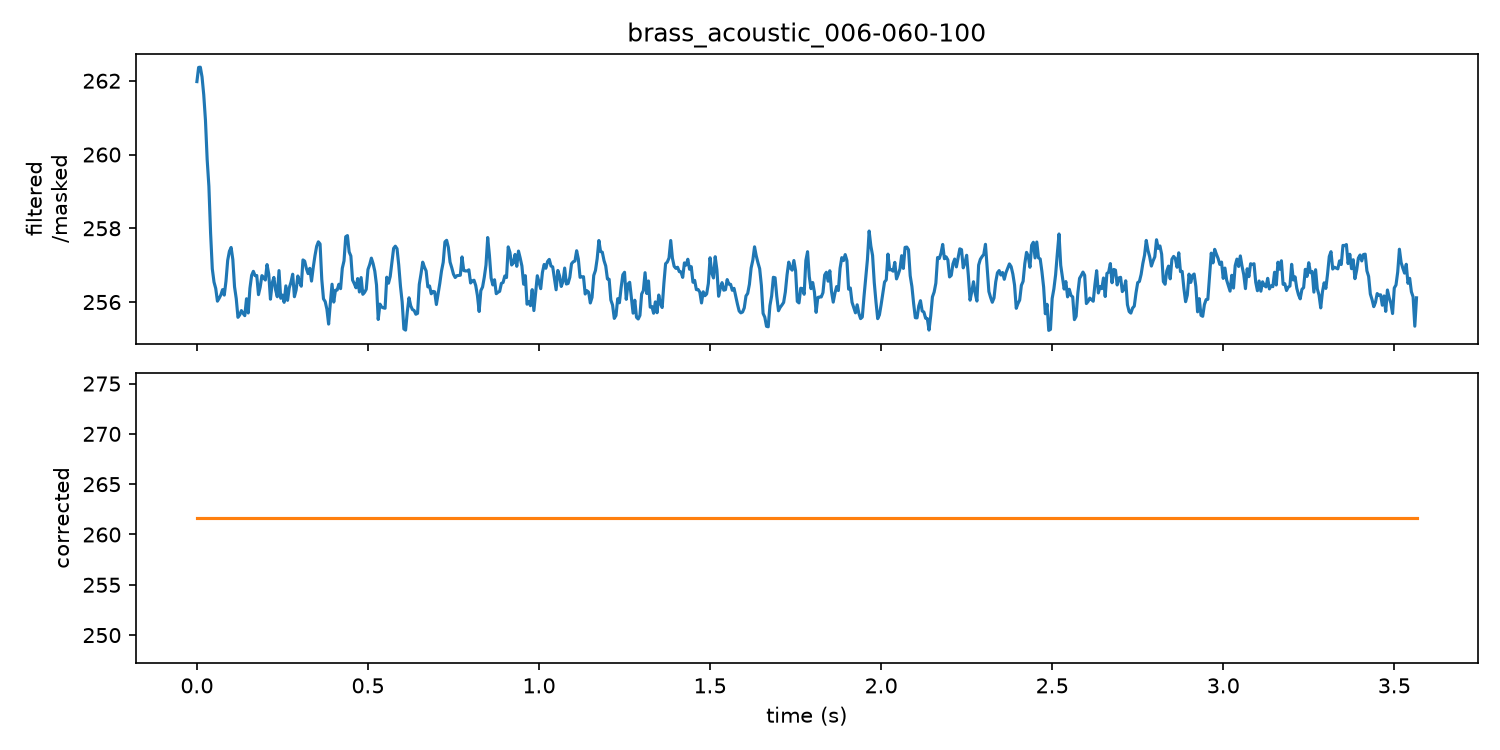
The same experiment was repeated using real instrument recordings instead of pure sine tones to see whether the pipeline holds up on realistic timbre. Five stems from the NSynth dataset [3] were chosen across different instrument families (guitar, bass, flute, vocal, brass), each detuned from its known true pitch by a known amount, and run through the same pitch tracking → filtering → correction pipeline as above.
The same boundary-tail pattern from the sine tones shows up here too.
The more interesting case is the vocal example. Rather than a small tail confined to the edges, the corrected curve bounces back and forth between two adjacent notes (roughly 349 Hz / F4 and 370 Hz / F#4) throughout the entire clip, not just at the boundaries. One explanation is that vocal audio is naturally less stable in pitch than a synthetic tone as even a sustained note has some vibrato and breathiness, so the raw estimate keeps drifting close to the 50-cent rounding boundary between F4 and F#4. Every time it crosses that boundary, the correction (running at full strength) immediately snaps to the other note, producing this rapid flicker instead of settling on one. This is a good concrete example of the timbre of real instrument/vocals causing audible artifacts noted in the About section.
Aggregate Detune Sensitivity
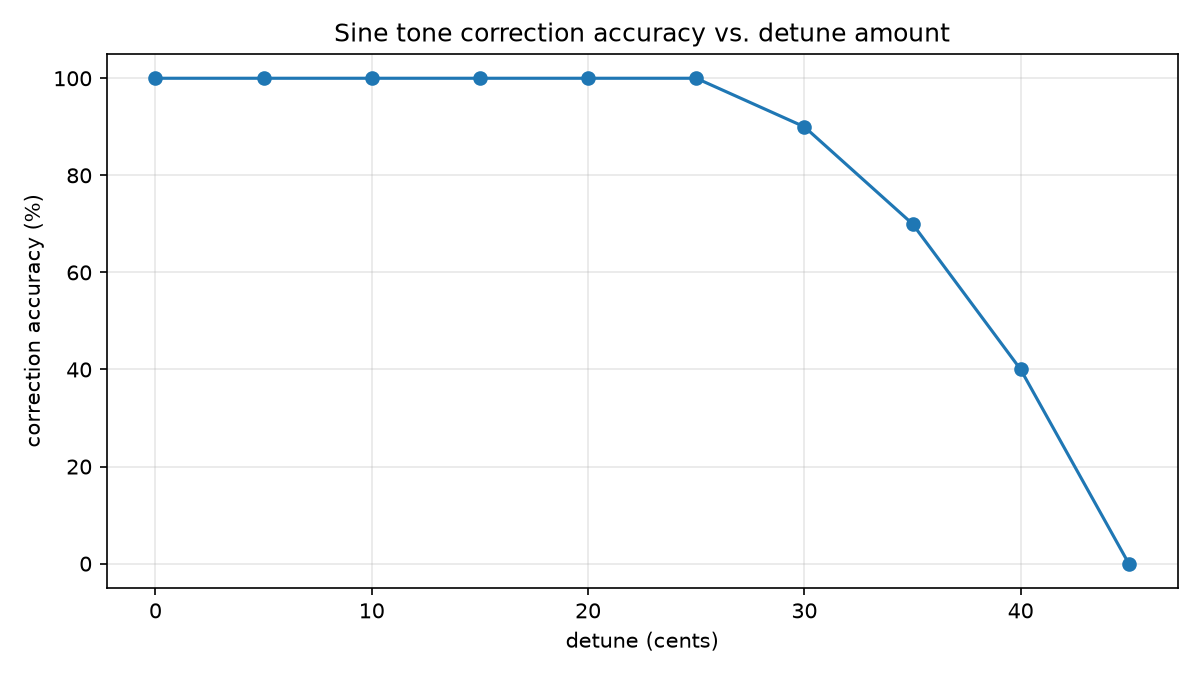
To get a better answer to "how far off can the input pitch be before correction starts landing on the wrong note," a sweep was run across ten detune levels from 0 to 45 cents (with a step of 5 cents). Ten different pure sine tone pitches were tested at each level. A sample counts as correct if the max cents error across all frames was equal to zero.
An identical sweep was first attempted using real NSynth instrument recordings across 10 instrument families (instead of sine tones) to test on more realistic timbre. However, that attempt was abandoned as certain instrument samples (particularly synthetic flute, organ, and vocal stems) triggered CREPE octave-tracking failures unrelated to detune level. This made the results too inconsistent to draw a clean conclusion from and did not serve the main purpose of tracking pure detune-sensitivity. Revisiting the NSynth version is a good next step but out of scope here.
Note: The first and last 0.2 seconds of each corrected pitch curve were clipped before comparison, to avoid the head/tail boundary inaccuracies noted above.
[Fig. 2] Correction accuracy across 10 pitches per detune level, 0-45 cents.
Detune (cents)
0
5
10
15
20
25
30
35
40
45
Accuracy
100%
100%
100%
100%
100%
100%
90%
70%
40%
0%
[Table. 3] detune sensitivity plot.
Correction is perfectly reliable through 25 cents (a quarter-tone) of detune, then degrades sharply as input approaches the 50-cent rounding boundary, reaching 0% accuracy right at the edge (45 cents). This makes sense as CREPE's few cents of inherent tracking noise are enough to occasionally push a borderline case over the line as the detune amount gets close to the 50 cent boundary
Audio Table
This table contains 7 audio examples across three categories:
Each input was run through the pipeline at two correction settings: a "subtle" natural-sounding correction and a "full/robotic" hard-tuned correction.
The knob settings for each are as follows:
Setting
Strength
Retune Speed
Deadzone (cents)
Subtle
0.6
0.8
15
Full / Robotic
1.0
1.0
0
[Table. 4] Audio Table correction knob settings.
As an external reference point, each input was also run through Graillon 3 [5] (free tier), a commercial pitch-correction plugin, hosted headlessly via Spotify's pedalboard library [6], shown in the Reference Baseline column below. The plugin was run at its default max settings, so it is comparable to the full strength outputs in the audio table.
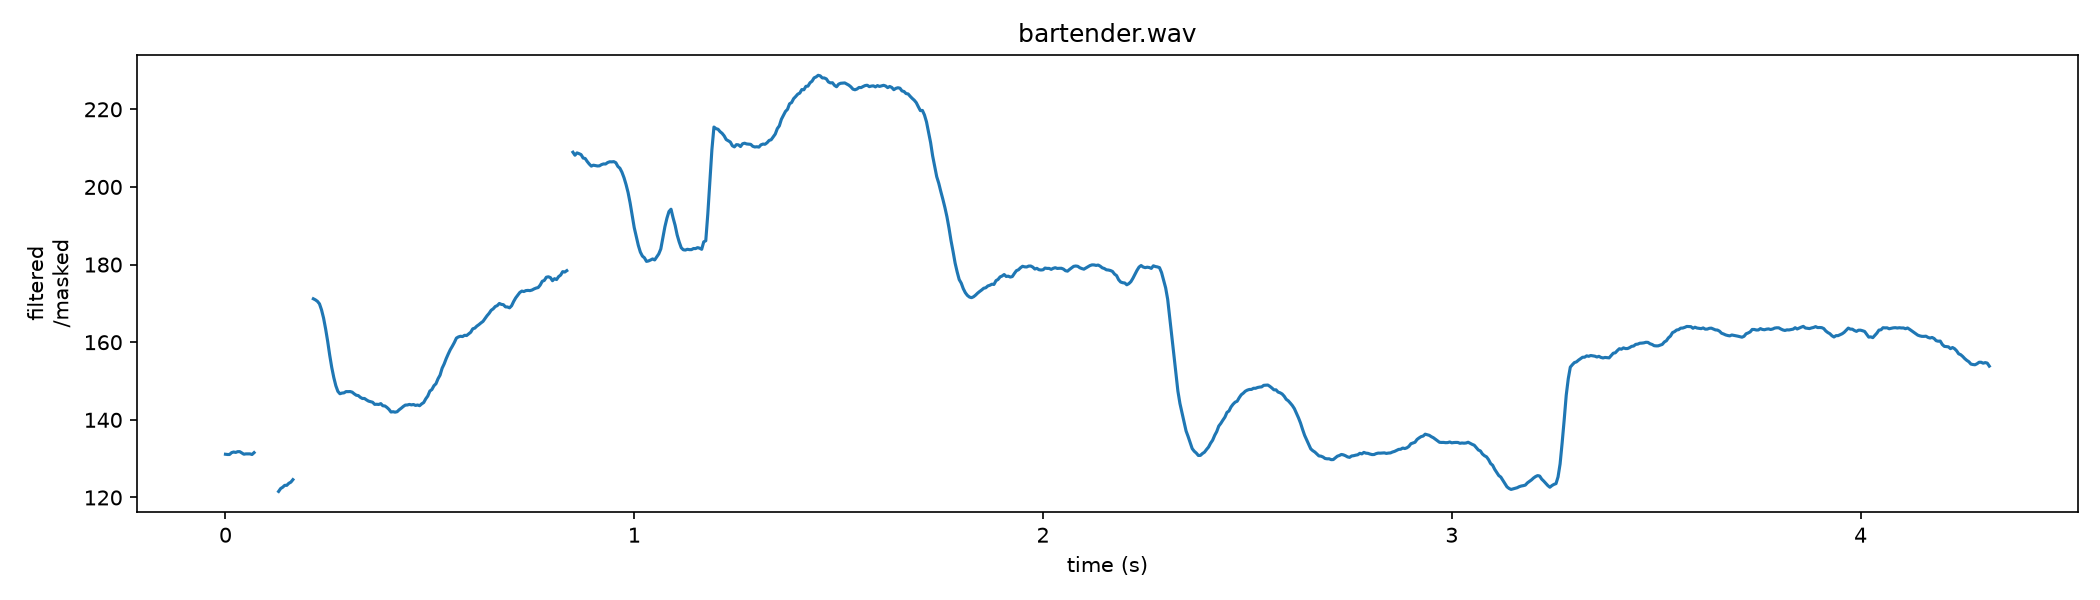
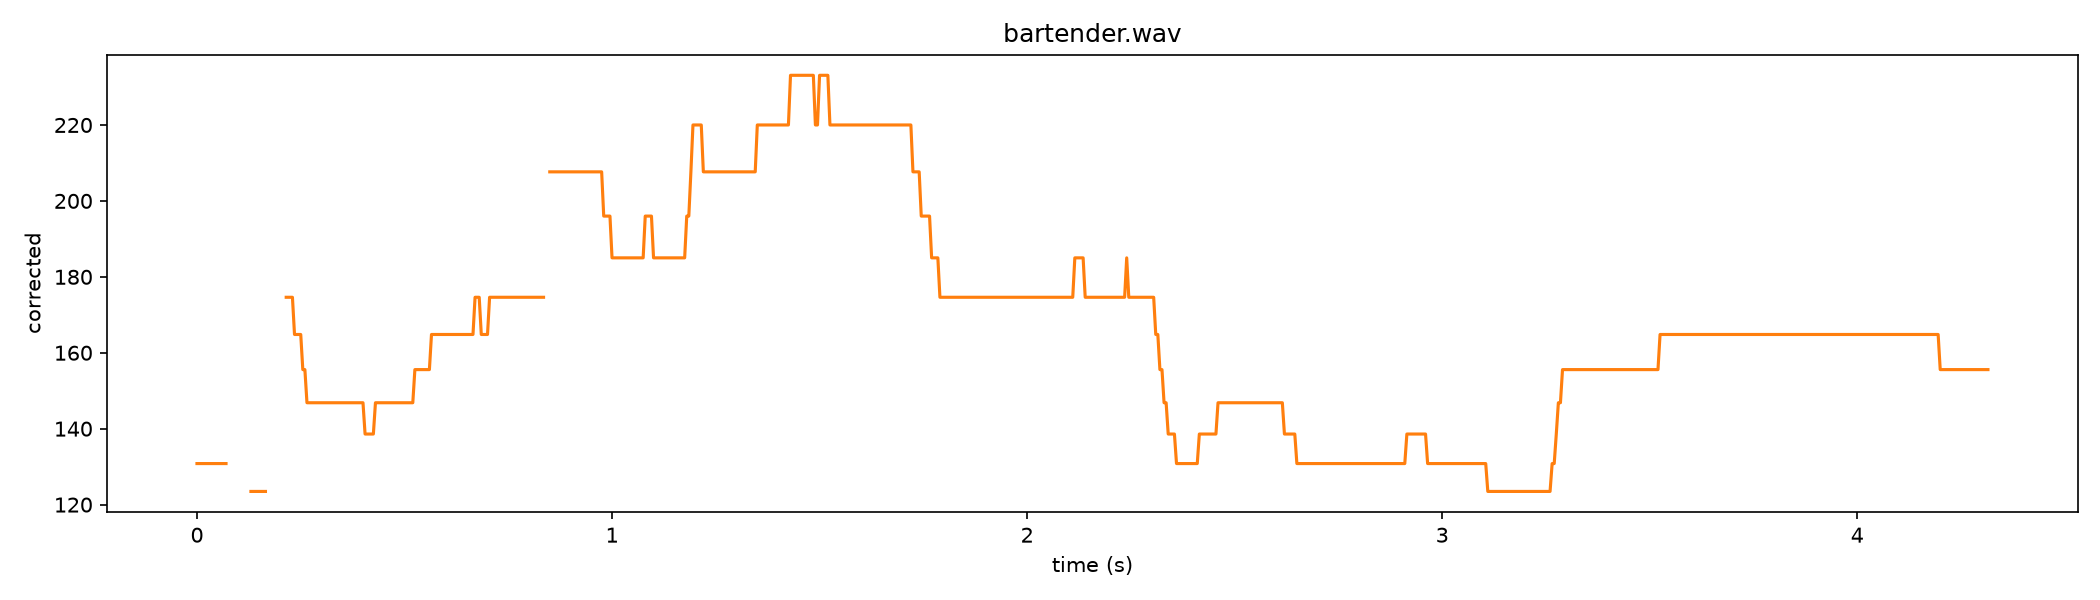
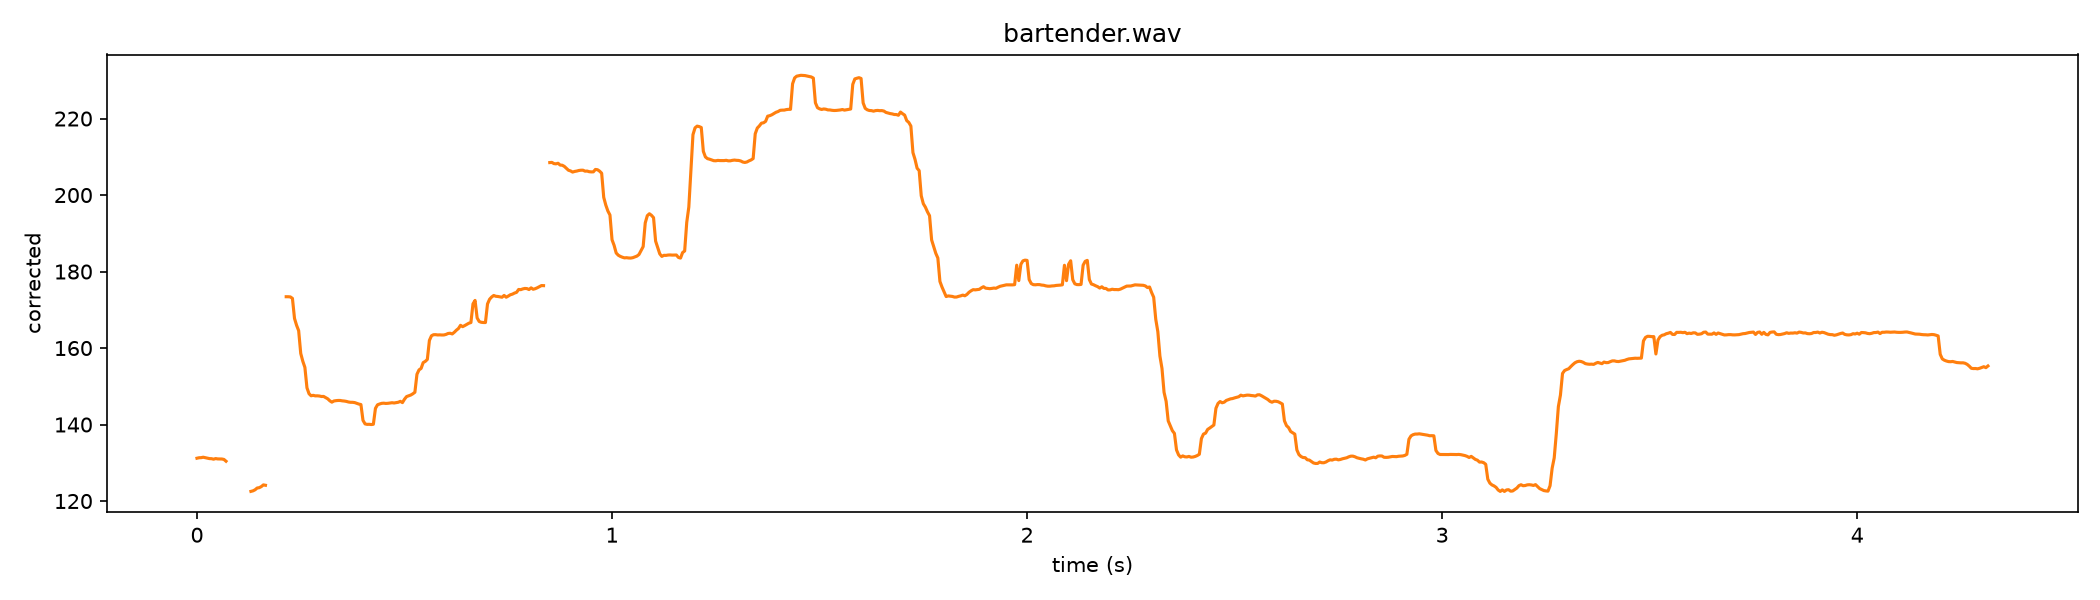
Let's look more closely at my rendition of "Bartender" by T-Pain. Below is the estimated pitch curve after tracking and filtering, followed by the corrected curve at full strength and at the subtle setting.
Note: The gaps are low-confidence or low-volume sections of the song that were masked out during filtering. These are populated later during PSOLA pitch shifting
[Fig. 3] Estimated pitch curve after tracking and filtering.[Fig. 4] Corrected curve at full strength (strength=1.0, retune speed=1.0, deadzone=0).[Fig. 5] Corrected curve at the subtle setting (strength=0.6, retune speed=0.8, deadzone=15 cents).
At full strength, the curve snaps hard onto each target note and holds it dead flat. This is the classic robotic, hard-tuned sound. At the subtle setting, transitions between notes blend rather than snap instantly, and small natural pitch deviations within a note are allowed to survive instead of being flattened out completely. This keeps some of the character of the original vocals.
Spotlight: Guitar
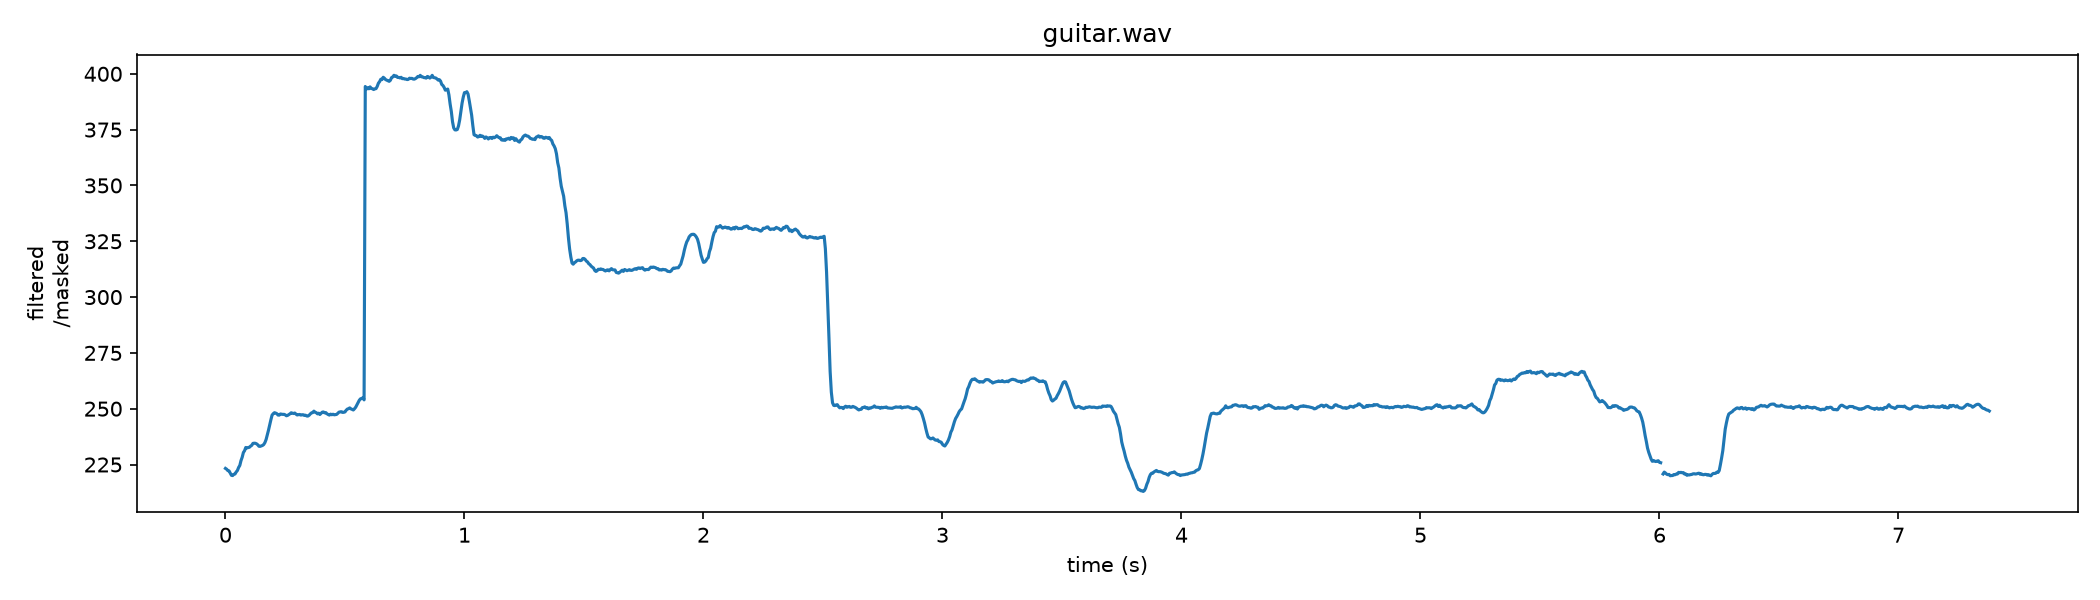
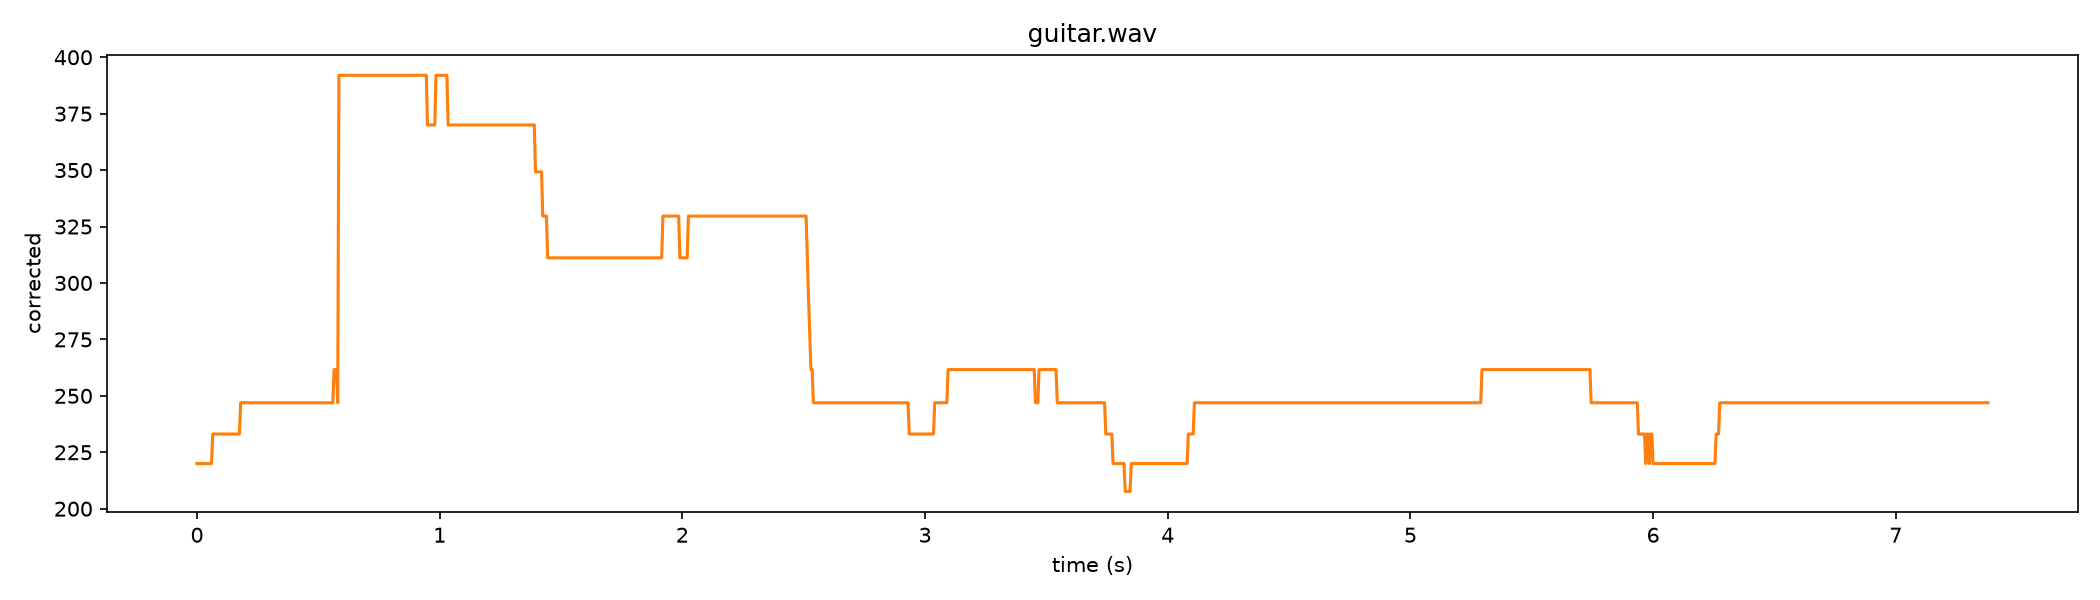
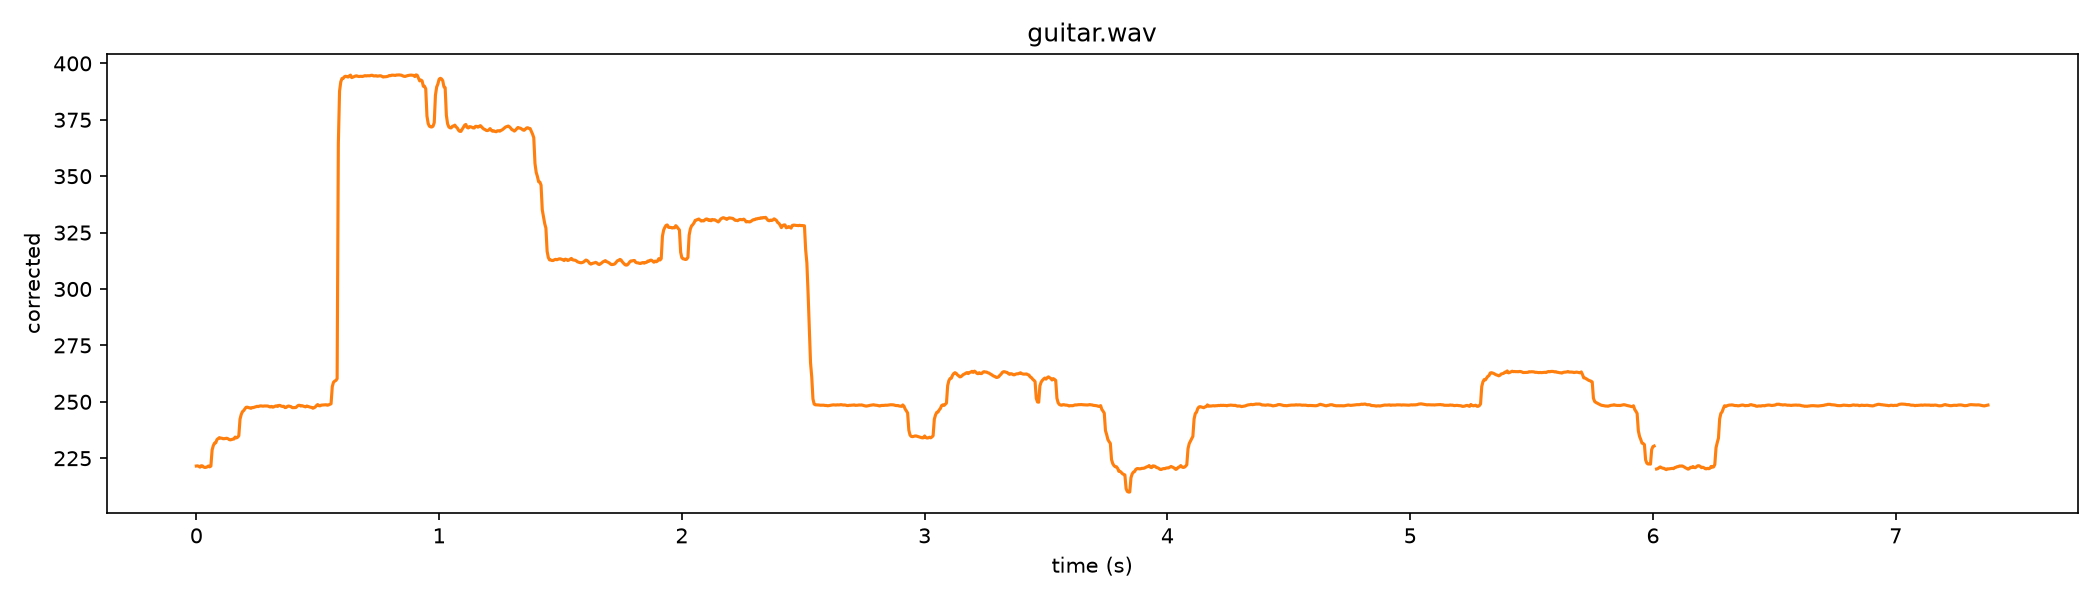
Now for the guitar, where it's hard to hear much audible difference between the corrected and uncorrected takes. That's because the guitar starts out mostly in tune and plays closer to the correct notes than I do as a musically uninclined singer. The same three plots below make it clear that correction is still happening, even where it's hard to hear.
[Fig. 6] Estimated pitch curve after tracking and filtering.[Fig. 7] Corrected curve at full strength (strength=1.0, retune speed=1.0, deadzone=0).[Fig. 8] Corrected curve at the subtle setting (strength=0.6, retune speed=0.8, deadzone=15 cents).
Even though the corrected audio sounds nearly identical to the original, the pitch curve shows real correction taking place. Small deviations from each target note are being pulled back into place. It's just subtle enough, on already mostly-in-tune input, to be difficult to hear.
Citations
J. W. Kim, J. Salamon, P. Li, and J. P. Bello, "CREPE: A Convolutional Representation for Pitch Estimation," ICASSP, 2018. Implementation: M. Morrison, torchcrepe.
M. Morrison, psola: Time-Domain Pitch-Synchronous Overlap-Add, 2021.
J. Engel, C. Resnick, A. Roberts, S. Dieleman, M. Norouzi, D. Eck, and K. Simonyan, "Neural Audio Synthesis of Musical Notes with WaveNet Autoencoders," ICML, 2017. Dataset: NSynth.
F. Font, G. Roma, and X. Serra, "Freesound Technical Demo," Proc. ACM International Conference on Multimedia, 2013. freesound.org.